From time to time you may experience network performance issues. This could include download speeds, upload speeds, or even laggy interactive desktops. Below are a few utilities that you can use to test your network performance.
How To Use Traceroute
Traceroute is a simple tool to show the pathway to a remote server. A pathway is generally a "hop" to other devices, like a router or firewall, between you and the end-point you're trying to reach.
The traceroute program is installed by default on just about every Linux distribution, so you shouldn’t need to install it.
To use it, you simply need to provide a hostname/FQDN and or an IP address, like in the example below:
Linux
traceroute cloud.nimbix.netWindows
tracert cloud.nimbix.nettraceroute cloud.nimbix.net [34.121.66.118]
1 3 ms 3 ms 4 ms 192.168.86.1
2 58 ms 20 ms 19 ms 142-254-141-061.inf.spectrum.com [142.254.141.61]
3 771 ms 33 ms 29 ms ae61.lwvltxid02h.texas.rr.com [24.164.211.209]
4 26 ms 20 ms 27 ms agg26.grpvtx1102r.texas.rr.com [24.175.50.73]
5 26 ms 35 ms 29 ms agg26.dllbtxlb02r.texas.rr.com [24.175.36.216]
6 27 ms 21 ms 22 ms agg21.hstqtxl301r.texas.rr.com [24.175.49.8]
7 35 ms 26 ms 26 ms bu-ether16.hstqtx0209w-bcr00.tbone.rr.com [66.109.6.108]
8 29 ms 31 ms 35 ms bu-ether12.dllstx976iw-bcr00.tbone.rr.com [66.109.6.39]
9 23 ms 24 ms 24 ms 107.14.18.149
10 * * * Request timed out.
11 23 ms 22 ms 23 ms 108.170.240.129
12 25 ms 23 ms 23 ms 108.170.240.145
13 28 ms 20 ms 25 ms 108.170.228.84
14 28 ms 32 ms 30 ms 209.85.250.140
15 48 ms 46 ms 48 ms 108.170.234.8
16 49 ms 45 ms 55 ms 172.253.79.12715 * * *
How To Read Traceroute’s Output
The first line tells us the conditions that traceroute is operating under:
traceroute to cloud.nimbix.net (34.121.66.118), 30 hops max, 60 byte packets It gives the specified host, the IP address that DNS returns for that domain, the maximum number of hops to check, and the size of the packet that will be used.
The maximum number of hops can be adjusted with the -m flag. If the host you are trying to route to is over 30 hops away, you may need to specify a larger value here. The maximum value you can set is 255.
traceroute -m 255 cloud.nimbix.net You can adjust the size of the packet that is sent to each hop by giving the integer after the hostname:
traceroute cloud.nimbix.net 70traceroute to traceroute to cloud.nimbix.net (34.121.66.118), 30 hops max, 70 byte packets
After the first line, each subsequent line represents a “hop”, or intermediate host that your traffic must pass through to reach the computer represented by the host you specified.
Each line has the following format:
hop_number host_name (IP_address) packet_round_trip_times
Here is an example of a hop you might see:
3 142.254.130.173 (142.254.130.173) 15.311 ms 24.615 ms 12.443 ms Here is what each field means:
-
hop_number: A sequential count of the number of degrees of separation the host is from your computer. Traffic from hosts with higher numbers have to go through more computers to get routed.
-
host_name: This field contains the result of a reverse DNS lookup on the host’s IP address, if available. If no information is returned from the reverse DNS query, the IP address itself is given.
-
IP_address: This field contains the IP address for this network hop.
-
packetroundtrip_times: The remainder of the line gives the round-trip times for a packet to the host and back again. By default, three packets are sent to each host and each attempt is appended to the end of the line.
-
If you would like to change the number of packets that are tested against each host, you can specify a number with the
-qoption, like this:traceroute -q1 cloud.nimbix.net
-
If you would like to forgo the reverse DNS lookup to speed up the trace, you can pass the -n flag:
traceroute -n cloud.nimbix.net
If your traceroute dissolves into some asterisks (*), there could be a problem with the route to the host.
5  * * *
6  * * *
What Does a Route Issue Mean?
If your traceroute attempt stops at a particular hop or node and cannot find a route to the host, you may have a problem.
Due to the fact that each ping represents a round-trip packet and the situation where packets often use different pathways in either direction, it may indicate a problem in a completely different, possibly closer route.
It also may be the case that the problem is with the hop directly after the last hop you see. It is difficult to diagnose the exact location of the problem unless you can get a return traceroute from that specific hop. This is usually not possible outside of your own network.
Another thing to consider when reviewing the output of your traceroute and you see a *, is that often times devices will de-prioritize ICMP traffic, which is what traceroute uses. When devices de-prioritize this, you'll see a * which doesn't necessarily mean there's an issue. The real value of using a traceroute is to in-fact determine which path you're taking to arrive at a particular destination.
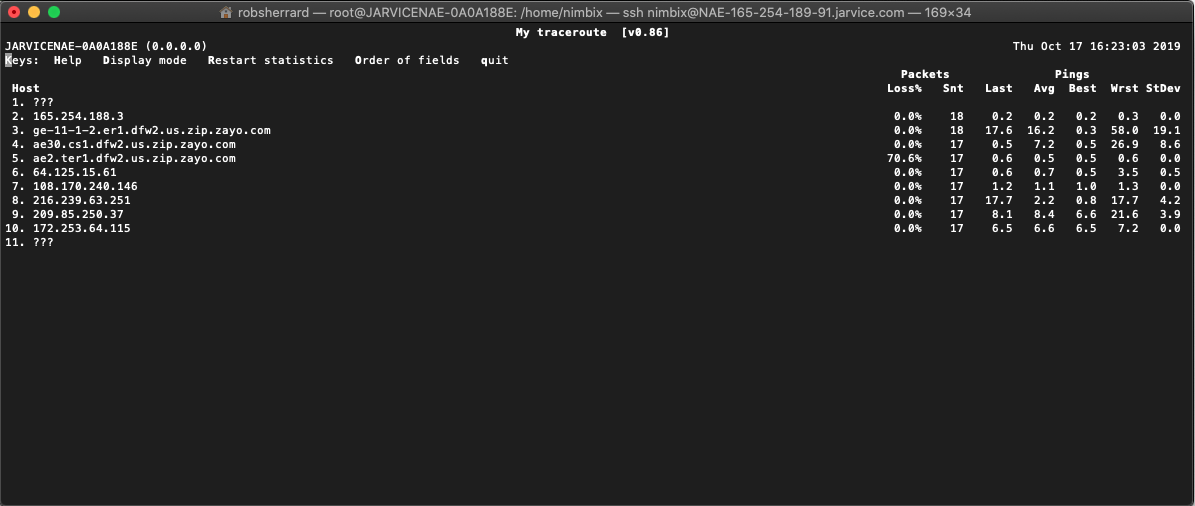
How To Use MTR
Another alternative to the traceroute is mtr. While not available on Windows, mtr is generally available on Linux platforms. We'll get into a Windows alternative, shortly, after discussing the value of mtr on Linux. Combining the functionality of ping and traceroute, mtr allows you to constantly poll a remote server and see how the latency and performance change over time.
How To Use Pathping?
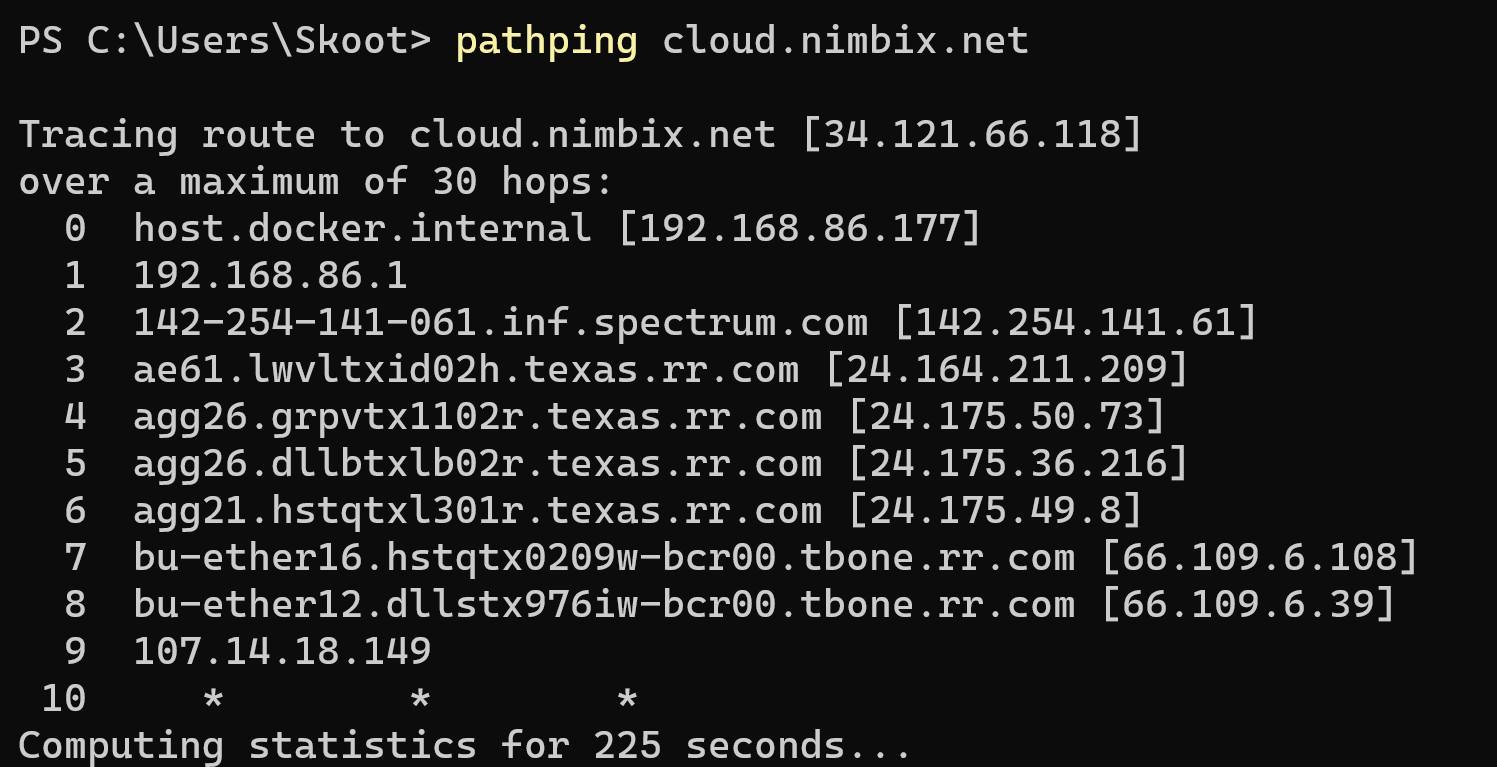
As we mentioned above, while mtr is only available on Linux, Pathping is available on Windows and is very similar to mtr and mtr values when determining possible network issues. Pathping is one of the most extremely useful built-in Windows network utilities that allows you to check the packet loss on a route to some remote network node (server or router), information about latency (delay) on a network, and also to understand at what stages of the packet transmission these losses or delays are happening. The pathping.exe utility has been included in the Windows since Windows NT/2000 and is located in the %windir%\System32 directory. It is also present in modern OSs like Windows 10 and Windows Server 2016/2019.
The utility combines the capabilities of two other standard Windows network utilities: ping and tracert, and also works on the basis of the ICMP protocol. The pathping first performs a route tracing to a remote node (like tracert), and then polls the destination node and all transit nodes using ICMP echo requests like ping. In this way, it is possible to obtain information about the losses at each stage of the transmission of network packets between your computer and a remote server.
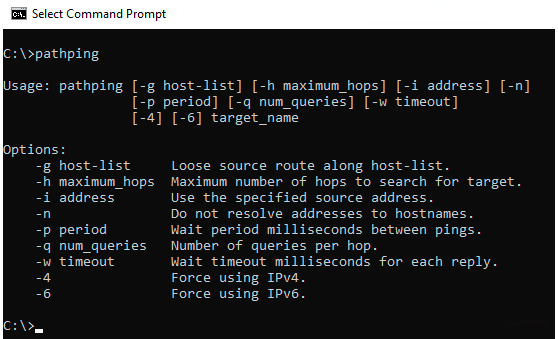
Usage: pathping [-g host-list] [-h maximum_hops] [-i address] [-n] [-p period] [-q num_queries] [-w timeout [-4] [-6] target_name
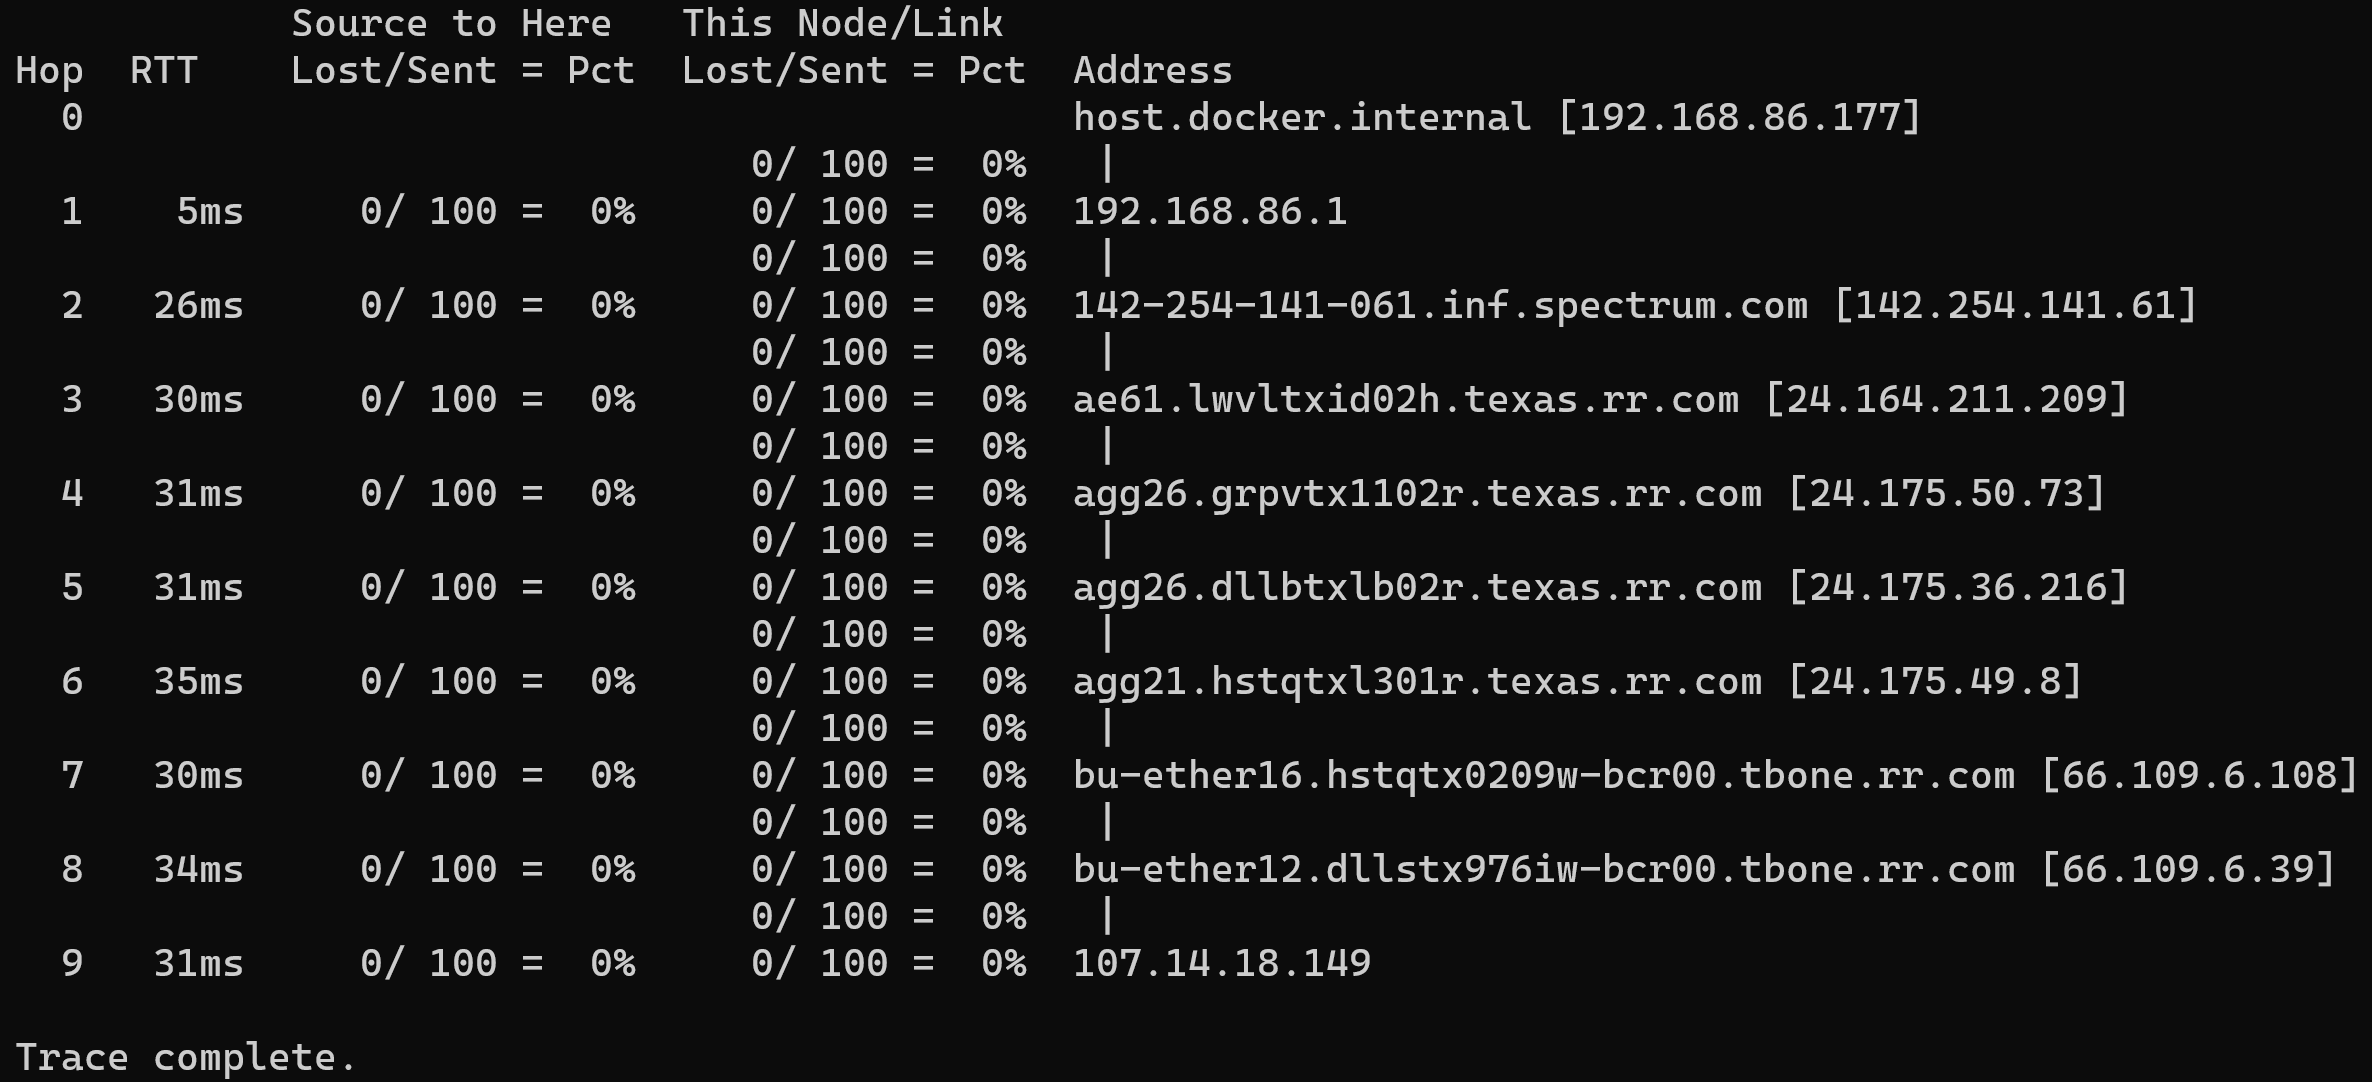
In our example above we don't see any packet loss, during our testing effort. Keep in mind, some packet loss is expected, which can be for a number of reasons. Typically if you see 100% packet loss, this is likely due to ICMP being blocked, and not a network performance issue. That said, any consistent packet loss of over 2-3% could indicate an issue, where you might normally expect ICMP traffic to be allowed.
Conclusion
Hopefully, the above utilities and tools are useful in helping you determine and test if you have potential network issues.
Let us know if you have a favorite tool you like to use in troubleshooting network performance-related issues, we'd love to hear from you.